There are certain things that you are going to want to make a point of looking out for whenever you are analyzing a data set, and it is important to always be vigilant in spotting these things, in order to get the greatest sense of what the data is communicating.
However, one specific factor that shows up in plenty of data sets and confounds data analysts of all skill levels is outliers.
What exactly is an outlier? How do you identify one? And what exactly can an outlier tell you about your data as a whole? Read on down below, because we have the answers to all of the questions you could possibly have!
What Is An Outlier?
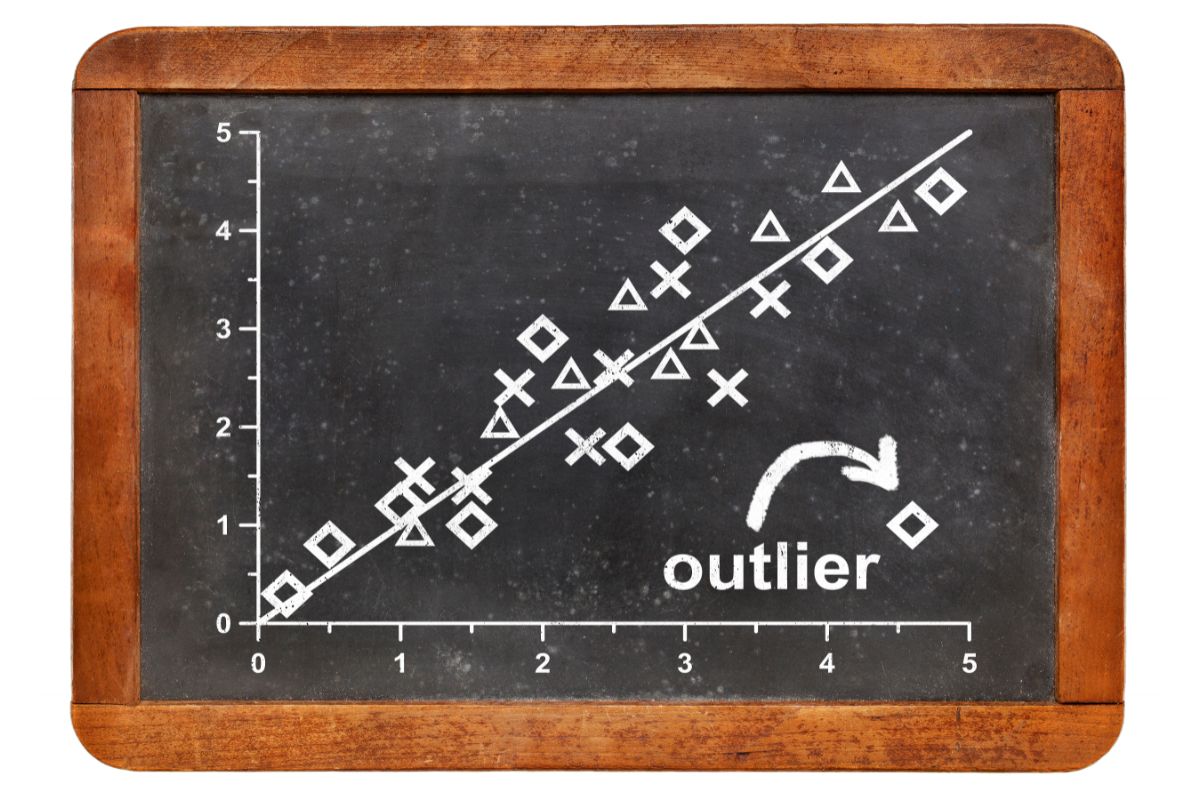
Put simply, an outlier is a value within a set of data that remains distinct from the rest of the data and sits apart from it. When data is put into a visual form, such as a bar chart, you will notice outliers causing spikes in areas that you may not otherwise expect.
Let’s say that Most of the bars on a bar chart display values that range from around 25 to 30.
If there were a bar on that same bar chart that had a value of around 2, or 96, then they would be considered outliers, because they do not fit the standard patterns that have been observed elsewhere within the data set.
Even before data has been put into a visual form, outliers can still be identified by looking at things such as the mean, the median, the mode, or the average of a set of data. These will help you to notice the numbers that don’t quite add up.
Can You Identify An Outlier In Qualitative Data?
Yes. Though this will be done with slightly more difficulty. If you are collecting data that is wordier, you will need to sift through the data (Also check out the How To Clean Data) to find statements that do not align with patterns that you have noticed in the rest of the data.
For example, if you were collecting data on how people perceive local parks in their area, and you find that around 99% of responses are happy with local parks, then the 1% that do not identify as loving local parks would be considered the outlier!
As you can see, though it is possible to identify outliers within qualitative data, as outliers are just values that do not fit the established norm, it takes considerably more work to identify them with qualitative data, because it needs to be analyzed in a way that mathematics or computing cannot compare to.
How Do You Identify Outliers In Quantitative Data?
Luckily, finding outliers in quantitative data sets is much easier, and simply requires you to manipulate the data in some simple ways.
The easiest and simplest way to identify outliers in your data set is to sort the data into numerical order. Start with the lowest numbers in your data set, and then organize them up to the highest numbers in your data set.
This process can be done near instantaneously using appropriate computer programs.
Doing this will allow you to identify whether the largest or smallest numbers stand out significantly from the rest of the data.
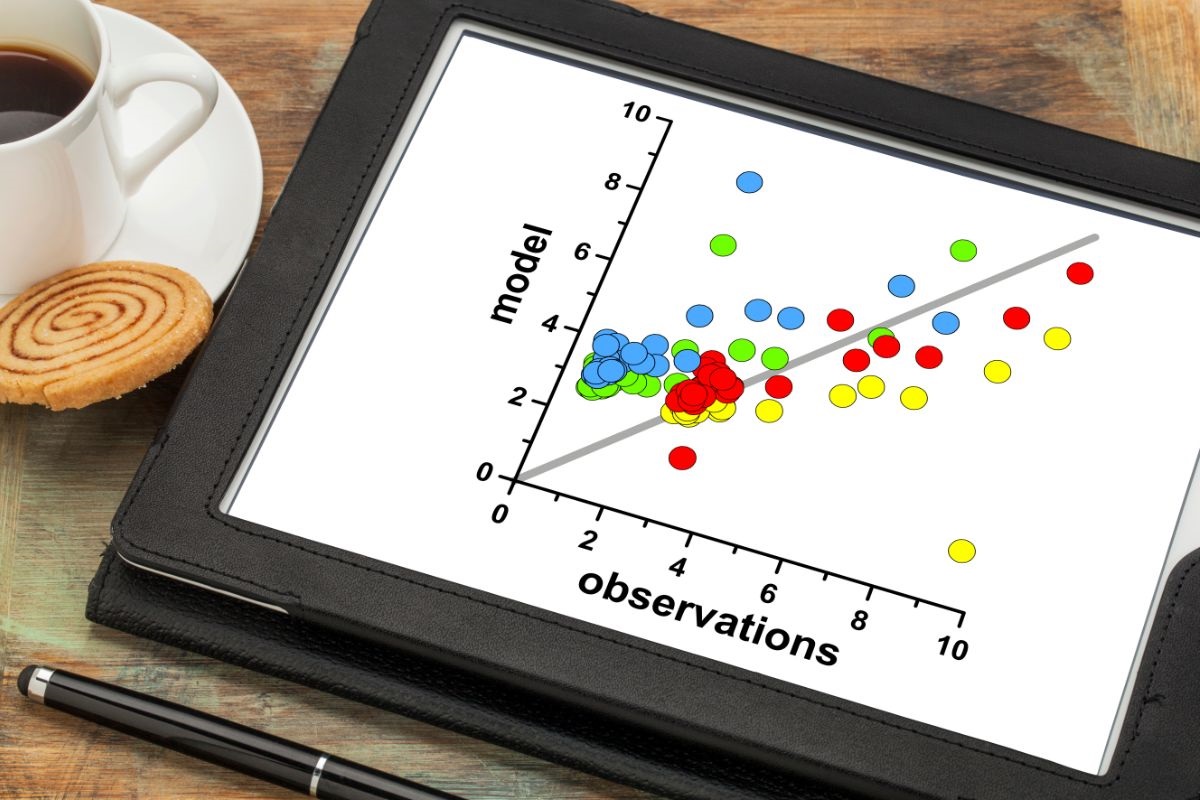
You can also make the job of identifying outliers much simpler by visualizing your data.
Using data visualization programs, you can create bar charts, pie charts, or other charts, which can help you instantly identify the parts of your data that do not align with the norm that the rest of the data adheres to.
You can also make use of the interquartile range, which helps you to identify the overall range of the center of your data set.
The interquartile range can then be used to identify the lowest and highest points that data within that range will fit in, which in turn can then be used to show you all data that sits outside of that range.
This is incredibly helpful because it helps you to identify your outliers using visual means.
Why Should You Bother With Identifying Outliers In Your Data?
It is incredibly valuable and important to dedicate some time to identify the outliers in your data because outliers can have a massive overall impact on the rest of your research.
Outliers can easily skew results away from an intended hypothesis, and can massively increase the time spent on research.
Looking out for outliers can also help you to identify new things that your hypothesis may not have otherwise foreseen.
However, you also want to make sure to look out for outliers in your data, because too many outliers can suggest that you have collected bad data, from which very few conclusions can be drawn.
If there are too many potential outliers in a given data set, then it could suggest that you have collected data that is erroneous in some way.
Take a look at the outliers, as they will likely be able to show you in what ways you can improve your research to avoid such errors in the future, and carry out a follow-up study.
To Wrap Up
As you can now see, outliers are values within a data set that do not align with the norm established by the rest of the data in the set. They can be identified in a number of ways in both qualitative and quantitative data sets.
Quantitative outliers can be identified by organizing the data in specific ways or converting it into visual forms. Qualitative outliers require a little more analysis to identify, as each value in the data set is unique in its own way.
It is valuable to identify outliers, as they can help researchers to identify potential weaknesses in their research processes.
Hi, my name is James Pithering and I have been obsessed with numbers from the day I could count to 10. Math was my favorite subject at school, and I even went on to study it in higher education.
There is just something so calming about math and numbers. No matter what is changing in your life, math is always going to be a constant. You’re not going to wake up one morning to suddenly find that 1 + 1 suddenly = 5!
There’s been a lot of change in my life through growing up, and so I found solace in numbers.
Understanding and properly utilizing a survey can be difficult, particularly to the untrained eye. Contents show 1 What Is The Mean? 2 What Would This Equation Look Like? 3 What…
If you are in the academic and scientific fields, there comes a time in life when you have to write your first short paper or even your thesis paper. Contents…
Measuring morale in any organization is key for a productive and motivated workforce. Surveys offer valuable insights into the wellbeing of employees, allowing employers to make informed decisions to raise…
Creating impactful survey questions requires a solid intro to set the tone. Make it bursty and creative for an engaging and memorable effect. The intro is essential to grasp the…
In today’s world, the internet promises all kinds of avenues and methods to earn some extra income. One of these methods is through surveys. Contents show 1 What Is Survey…
We all use data. It’s part and parcel of modern-day life as we use our smartphones, laptops, PCs, tablets, and other devices. Contents show 1 Data Cleaning – Explained 1.1…