Navigating through the realm of statistical analysis, the Z Score Calculator emerges as an indispensable tool for researchers, statisticians, and data analysts alike. This comprehensive guide aims to elucidate the multifaceted applications and functionalities of the Z Score Calculator, ensuring that you can seamlessly calculate and interpret Z scores and p-values, thereby enhancing your statistical analyses.
The Z Score Calculator is not merely a tool but a gateway to robust statistical analysis. It effortlessly calculates the Z-score from a given raw score and also computes the areas under the normal curve, which are pivotal for p-value calculations. Moreover, it provides a Z table, which is integral for identifying Z scores and corresponding p-values, thereby facilitating a more nuanced understanding of your data.
Diving Deep into Z Distribution
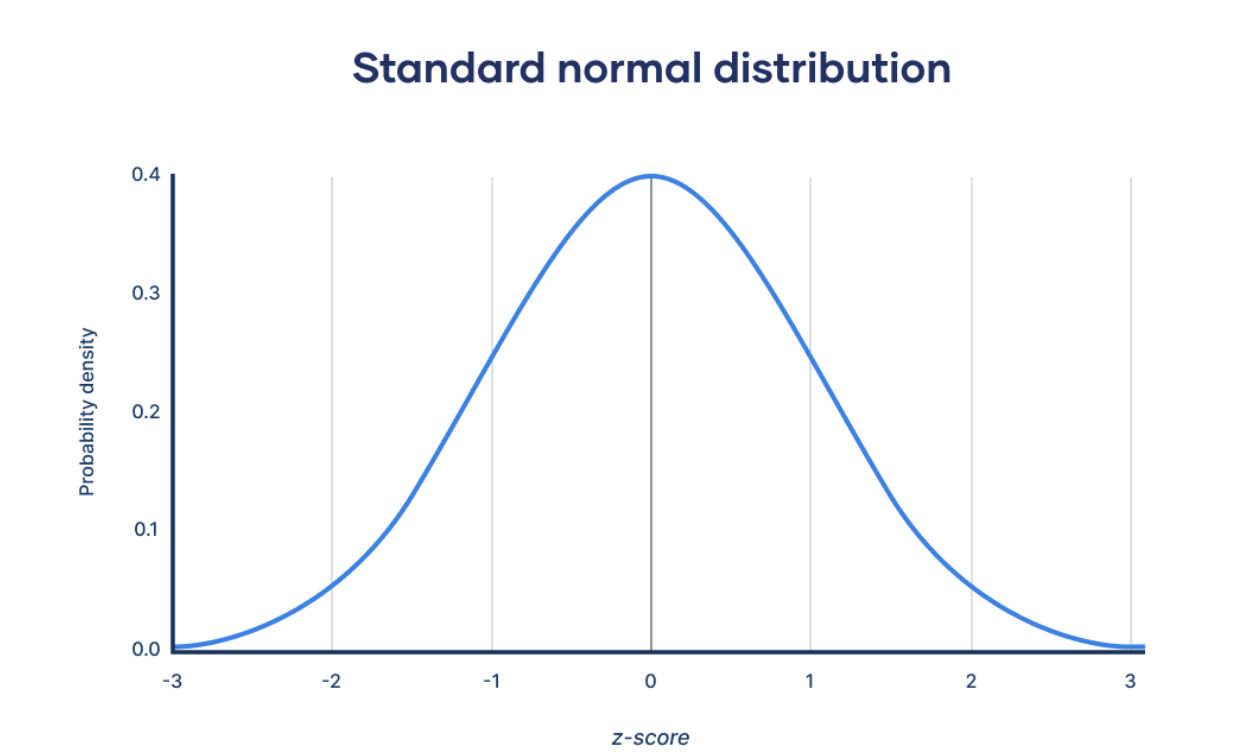
Understanding Z Distribution is paramount for utilizing the Z Score Calculator to its fullest. The Z distribution, characterized by a mean of 0 and a standard deviation of 1, is a standard normal distribution that provides known quantiles and ensures that the area between any two Z scores is also known. This standardized distribution, with its known quantiles and defined areas between Z scores, becomes a potent tool in various statistical and probability calculations.
Decoding the Z Score
The Z Score, also known as the standard score or z-value, is a dimensionless quantity that signifies the number of standard deviations an observed data point is from the mean of a distribution. Z scores find their application in various statistical inferences and estimations, such as Z-tests of significance and confidence interval calculations. Moreover, Z scores are pivotal in process control and quality assurance applications, such as six sigma, and are instrumental in comparing measurements across different scales in various scientific and applied disciplines.
The Formula Behind Z Score Calculations
The Z Score formula is a straightforward yet powerful equation that allows for the conversion of a raw score from a normal distribution to a standard score. This conversion, facilitated by the Z Score Calculator, enables quick and accurate computations, ensuring that your statistical analyses are both precise and reliable.
Navigating Through the Z Table
A Z table, which contains tabulated values of the Z distribution and their corresponding quantiles or percentages, is crucial for defining critical regions for normally distributed random variables. While the utility of a physical Z table may be limited in the digital age, utilizing an online Z table calculator, like the one provided by GigaCalculator, ensures that accurate and precise values can be obtained with ease and efficiency.
Final Thoughts
The Z Score Calculator is a robust tool that facilitates a myriad of statistical calculations and analyses. From calculating Z scores and p-values to providing a comprehensive Z table, this calculator ensures that you are well-equipped to navigate through your statistical analysis journey. Whether you are a seasoned statistician or a novice researcher, mastering the Z Score Calculator and understanding the underlying concepts of Z distribution and Z scores will undoubtedly enhance your analytical capabilities.
Frequently Asked Questions (FAQs)
Q: How does the Z Score Calculator handle non-normal distributions?
A: The Z Score Calculator is specifically designed for normal distributions, and particularly the standard normal distribution (Z distribution). For non-normal distributions, the Z score and associated probabilities may not be accurate or applicable. It’s crucial to ensure that your data is approximately normally distributed, or that the Central Limit Theorem can be applied, before using the Z Score Calculator for accurate results.
Q: Can the Z Score Calculator be used for predictive analytics?
A: While the Z Score Calculator is a valuable tool for statistical analysis, it is not inherently designed for predictive analytics. It calculates Z scores and related probabilities based on provided or known data (such as mean and standard deviation) but does not predict future data points or trends. For predictive analytics, additional statistical methods and models, such as regression analysis or machine learning algorithms, would be more appropriate.
Q: How does the Z Score Calculator deal with outliers in the data?
A: The Z Score Calculator does not inherently manage or adjust for outliers in the data. It calculates the Z score based on the provided raw score, mean, and standard deviation without making adjustments for potential outliers. It’s essential to conduct preliminary data analysis to identify and manage outliers as appropriate before utilizing the Z Score Calculator to ensure accurate and reliable results.
Q: Is it possible to use the Z Score Calculator for paired sample tests?
A: The Z Score Calculator is primarily designed for calculating Z scores and associated probabilities for individual data points in relation to a distribution. For paired sample tests, which involve comparing two related groups, additional statistical methods and tests, such as the paired sample t-test, may be more appropriate to analyze the differences between the paired observations.
Q: Can the Z Score Calculator be utilized for categorical data analysis?
A: The Z Score Calculator is intended for continuous data that is (or can be approximated as) normally distributed. Categorical data, which may be nominal or ordinal, is not suitable for Z score calculations using this tool. For analyzing categorical data, alternative statistical methods, such as Chi-Square tests or logistic regression, might be more applicable and provide meaningful insights.
Explore what America’s thinking with two of the country’s leading pollsters–the bipartisan team of Democrat Margie Omero and Republican Kristen Soltis Anderson. In this weekly podcast we take a fresh, friendly look at the numbers driving the week’s biggest stories in news, politics, tech, entertainment and pop culture. Along with the occasional interview with pollsters, journalists, and other industry leaders, we’ll lift the hood on the numbers revealing the hidden secrets of the public’s mind.
Follow us on Twitter or find us on Facebook to stay up-to-date on the latest polls around the country.
Ratio is a very helpful tool that allows you to compare things to one another. It is very commonly used in Mathematics. Ratios are also used in the real world,…
Understanding and properly utilizing a survey can be difficult, particularly to the untrained eye. Contents show 1 What Is The Mean? 2 What Would This Equation Look Like? 3 What…
The letter ‘S‘ in statistics holds great importance. It provides insight into data and has many applications. It is an essential tool for researchers, analysts, and decision-makers. Contents show 1…
Descriptive statistics and inferential statistics are two branches of statistics that serve different purposes in analyzing and interpreting data. Understanding the difference between the two is essential for conducting meaningful…
We come across variables every day, no matter what we are doing. Generally speaking, variables are anything that can change or be changed in an experiment or situation. Contents show…
Tackling the mysterious realm of AP Statistics can be challenging for students. Learning the nuances of data analysis, probability, and hypothesis testing calls for a strategic approach. This article will…