- Biden Vs. Trump Who Will Win? - February 2, 2024
- The Power and Simplicity of Straw Polls - October 21, 2023
- Binomial Distribution Calculator - October 21, 2023
Standard deviation, often abbreviated as SD or denoted by the Greek letter sigma (σ), plays a pivotal role in statistics and probability theory, serving as a measure to quantify the dispersion or variability within a data set. This article aims to demystify the concept, calculation, and practical applications of standard deviation, providing you with a robust understanding and a handy calculator tool to assist in your statistical explorations.
Understanding Standard Deviation
Standard deviation is not merely a statistical term but a lens through which we can gauge the dispersion or spread of data points in a set. A lower standard deviation indicates that data points are closely packed around the mean, signifying low variability, whereas a higher standard deviation denotes a wider spread, implying high variability. This concept is crucial in various fields, including finance, science, and weather forecasting, as it provides insights into data reliability and predictability.
Calculating Standard Deviation: A Step-by-Step Guide
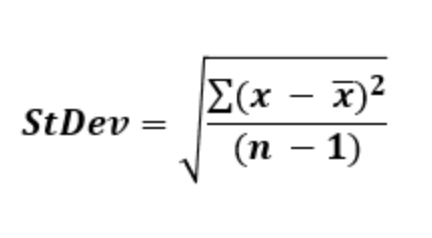
Calculating standard deviation involves a series of steps, beginning with determining the mean (average) of the data set and followed by calculating the variance, which is the average of the squared differences from the mean. The standard deviation is then obtained by taking the square root of the variance. It’s imperative to note that the calculation slightly varies depending on whether the data represents a sample or an entire population, necessitating different formulas for each scenario.
Interpreting the Standard Deviation: Beyond the Calculations
Interpreting standard deviation goes beyond mere calculations, providing a window into understanding the data’s spread and its adherence or deviation from the mean. It serves as a metric to gauge the precision of tools or the reliability of data, acting as a measure of uncertainty or variability. Various fields utilize standard deviation cut-offs to determine percentiles, which in turn, assist in data analysis and decision-making processes.
Practical Applications: Standard Deviation in the Real World
- Statistical Inference: In scientific research, standard deviation aids in hypothesis testing, where the observed data is compared against the expected outcome to infer statistical significance and breakthroughs.
- Finance: In the financial realm, standard deviation is employed to estimate the risk associated with financial assets, though its equivalence to risk is subject to debate and scrutiny.
- Weather Forecasting: In climatology, standard deviation assists in comprehending the fluctuations in climate data, such as daily temperatures, providing insights into weather patterns and anomalies.
Conclusion
Standard deviation stands as a cornerstone in statistical analysis, offering a measure to understand and interpret the variability within a data set. From calculating and interpreting to applying the concept in various fields, standard deviation remains an indispensable tool in data analytics. Our Standard Deviation Calculator serves as a convenient tool to assist you in your calculations, ensuring accuracy and efficiency in your statistical endeavors.
Frequently Asked Questions (FAQs)
Q: How is standard deviation different from variance?
A: While both standard deviation and variance measure the dispersion of data points in a set, they are different in terms of units and application. Variance is calculated as the average of the squared differences from the mean, and it is expressed in squared units, which might not always be intuitive or directly comparable to the original data. On the other hand, standard deviation, being the square root of variance, is expressed in the same units as the data, making it more interpretable and widely used in data analysis.
Q: Can the standard deviation be negative?
A: No, standard deviation cannot be negative. Since it is derived from the square root of variance and involves squaring the differences between data points and the mean, the values under the square root cannot be negative. Thus, the standard deviation is always non-negative, with a standard deviation of zero indicating that all data points are identical and increases as the data points become more dispersed.
Q: How does standard deviation relate to the bell curve (normal distribution)?
A: In a normal distribution, often referred to as a bell curve due to its symmetrical bell-like shape, about 68% of the data falls within one standard deviation of the mean, 95% falls within two standard deviations, and 99.7% falls within three standard deviations. This rule is known as the Empirical Rule or the 68-95-99.7 (Three-Sigma) Rule and showcases how standard deviation can be used to understand the distribution and dispersion of data in a given set.
Q: What is the significance of a low or high standard deviation in real-world scenarios?
A: A low standard deviation indicates that the data points are closely clustered around the mean, suggesting consistency and low variability, which might be interpreted as reliability in certain contexts, like manufacturing or quality control. Conversely, a high standard deviation indicates a wide spread of data, which might suggest high variability or inconsistency. In investment, for instance, a high standard deviation might be associated with high risk due to the volatile returns.
Q: How is standard deviation utilized in quality control within industries?
A: In industrial quality control, standard deviation is pivotal in creating control charts, which help in monitoring and controlling the quality of processes. A process is deemed to be in control if the data points (e.g., product dimensions or error rates) are within acceptable limits, often determined by specific standard deviations from the process mean. If the data points fall outside these limits, it may indicate that the process is out of control, prompting further investigation and corrective actions.

